Making my website fast without changing a pixel
Mobile PageSpeed score from 66 to 98 (out of 100) in an evening, and the design did not move

On Saturday evening I ran my website through PageSpeed Insights. Desktop got a PageSpeed score of 99 out of 100. I felt good about that for a few seconds, then I clicked the mobile tab.
A Performance score of 66 out of 100. Total Blocking Time 11.6 seconds. Not milliseconds, seconds. And at the top of the report, a small grey note: "The page loaded too slowly to finish within the time limit." Lighthouse had given up on my home page.
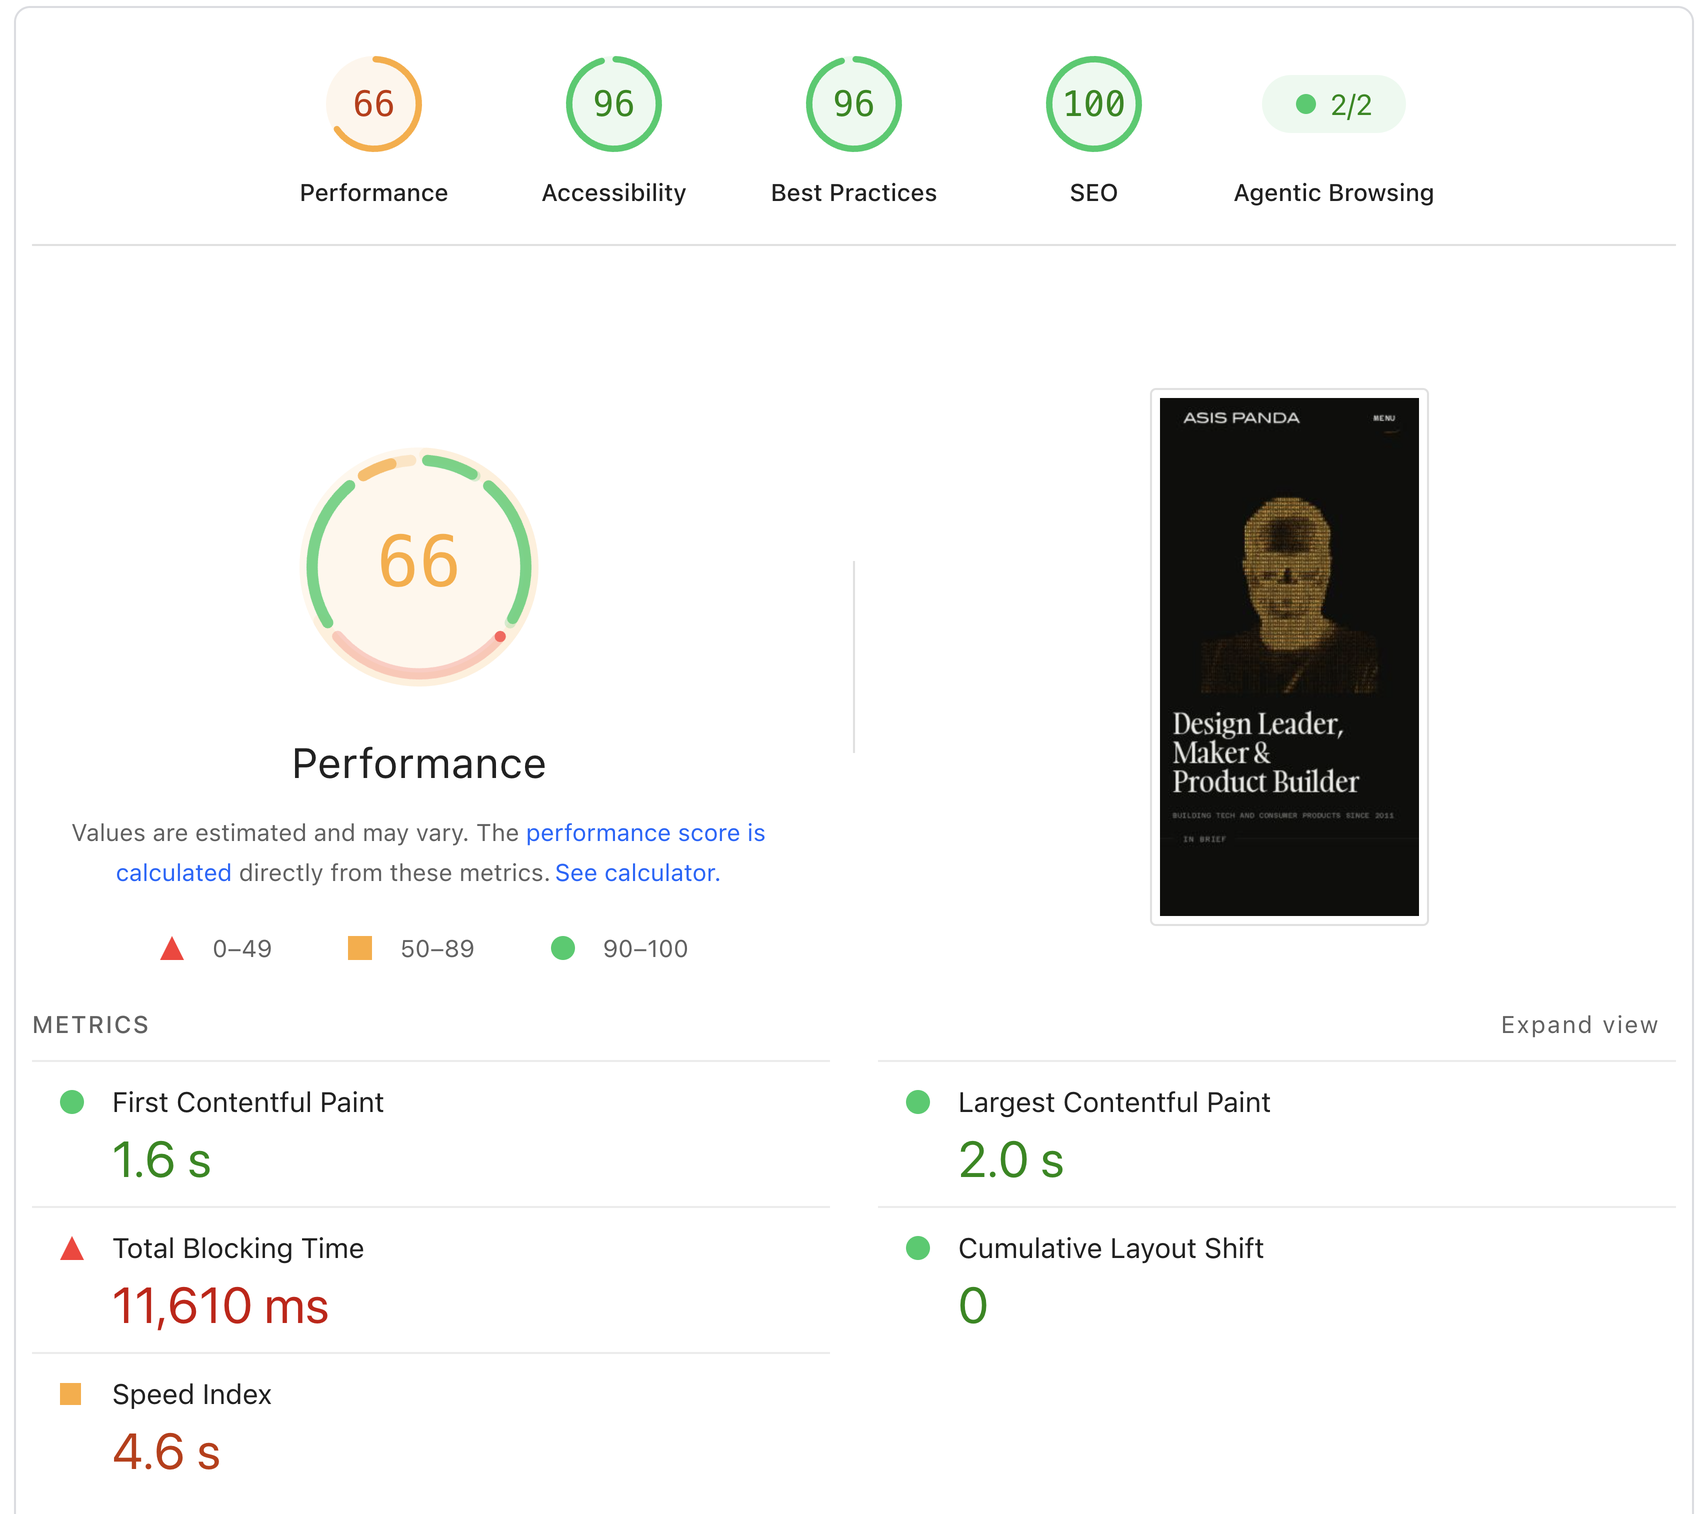
I designed and built this site myself, so this was mildly embarrassing. The rest of the evening went into fixing it, with my agent (Hermes) doing the typing and me doing the deciding. Two rules before anything else. The design must not change, not by a pixel. And nothing may break.
What was actually wrong
Lighthouse lists plenty of small sins. Traced back, three things caused roughly 95% of the damage.
The first was images. Two of the covers on the home page and the blog list were 7 MB PNGs each. AI-generated covers, uploaded raw and never thought about again. Add a 1.2 MB PNG and a 640 KB one, and the home page weighed 11.7 MB. One blog thumbnail literally timed out during the test.
The second was the hero. The top of my home page is a WebGL fragment shader that paints a "phosphor" portrait of me out of glyphs, using noise, fbm and scanlines. I'm fond of it. It already paused when you scrolled away and it respected reduced motion, so I assumed it was well behaved. Lighthouse, it turns out, runs Chrome without a GPU, on a software renderer called SwiftShader. My loop ran at 60 fps forever, and the test machine spent 39 seconds of CPU on my face.
To be fair to the shader, real phones have GPUs and render it fine, so part of that number was an artefact of the test. The other part was real. The loop never let the page go idle, on any device.
The third was analytics. I self-host OpenPanel, and its tracking endpoint had no CORS header for the site. So every page view failed with console errors, and the script kept retrying until it gave up. This had been going on for months. Nobody noticed, including me, which says a lot about how closely I was reading those dashboards.
That one was the easiest decision of the evening. Fixing it was one header. I removed it entirely instead. If I hadn't missed the data in months, I didn't need it. Cloudflare already counts traffic at the edge, and for a personal site that is plenty.
Images, as a policy
The lazy fix was to re-export those two covers and move on, until the next time I uploaded something raw. Knowing myself, that would not be long.
So we wrote an encoding policy into a single file. WebP at quality 82. Long edge capped at 2400 px, which is twice my 1200 px column. Lossless WebP when that turns out no larger, which it often does for flat graphics and screenshots. Keep the original JPEG if WebP can't beat it by at least 8%. Never upscale.
That policy now runs on every upload through TinaCMS. Then a script ran it over everything already in the uploads folder: 208 PNG and JPEG files, 112 MB down to 14 MB, which is 88% smaller. It also rewrote 215 references across my posts and case studies, so nothing points at a file that no longer exists. The originals sit in a tarball on the server.
The part I like most is the build guard. The Docker build now fails if any image over 800 KB sneaks into uploads. "Things should only get better" stopped being an intention and became a rule the build enforces. I don't have to remember it, which is the only way I reliably remember anything.
Sharpness, measured
This is where I got fussy. I distrust optimisations that quietly make things worse, and image compression is the classic case. It looks fine at a glance, until one day your work looks a bit soft and you can't say why.
The first attempt at responsive thumbnails (quality 84, smallest variant 480 px) looked visibly softer in the before and after screenshots. We threw it away.
For the second attempt we measured instead of eyeballing. Laplacian variance (a crude but honest measure of edge detail), converted image against a lossless downscale of the original. The new images keep between 82 and 101% of the original's sharpness at display size. Thumbnails are never served below 1200 px wide, deliberately, so they stay as crisp as the browser shrinking the original would have been.
PageSpeed still wants me to shave another 200 KB off a mobile thumbnail. I'm keeping it. That is the price of sharpness parity, and I would rather pay it than have my covers go mushy on a phone.
Letting the shader rest
For the hero, the fix was to make it lazier, not to take it out. On software GL, or with Save-Data on, it now renders a single static frame. Same picture, just no drift. When nothing is moving (no pointer, no theme crossfade) it drops to 30 fps. The easing is now time based, so the motion runs at the same speed at either frame rate. And the loop now waits for requestIdleCallback before starting, so it never competes with the headline for the first paint.
You can't tell the difference by looking at it. That was the point.
The smaller things
The video of me walking across the hero had a quieter problem. The mp4 was encoded yuv444p, which most phone hardware decoders can't play. Re-encoded to yuv420p, with the dark mode WebM tightened too, the pair went from 3.0 MB to 1.7 MB at SSIM above 0.997. Only the current theme's video loads now.
Azeret Mono was shipping as a raw TTF, and is now WOFF2. All 13 KB of page CSS is inlined into the HTML. The liquid-glass pills in the header were forcing a reflow, and now measure on the next frame. Proper cache and security headers went in at the origin, with the Content-Security-Policy in report-only mode for a clean week before it enforces anything.
Things I found without looking
Production was running Node 18, which crashed, reproducibly, whenever a visitor disconnected halfway through a 404 page ("Controller is already closed"). Docker quietly restarted it every time, so nobody had ever seen it. Node 22 fixed it.
The other was a small lesson in humility. One screenshot showed my footer had vanished. It turned out Lenis, the smooth scroll library, fights programmatic scrolling, so the reveal never fired. With real mouse wheel events it was there all along. Verify with the same input a human would use.
How I checked
Every change went into a staging container first. A crawler fetched all 52 pages and all 427 assets they reference, and every one came back 200. Then full page screenshots at 390 px and 1440 px, light and dark, compared pixel by pixel. The only differences were animated elements and the footer line, which now reads "Node · Docker · Cloudflare" instead of crediting OpenPanel. A rollback image was tagged before the swap. I didn't need it.
Where it landed
The mobile PageSpeed Performance score went from 66 to 98 out of 100. Total Blocking Time from 11,610 ms to 0 ms. Speed Index from 4.6 s to 1.9 s. Page weight from 11.7 MB to 1.37 MB. The Best Practices score went from 96 to 100, SEO stayed at 100 and Accessibility stayed at 96, all out of 100. Desktop now scores 100 out of 100 in all four categories. Zero console errors.
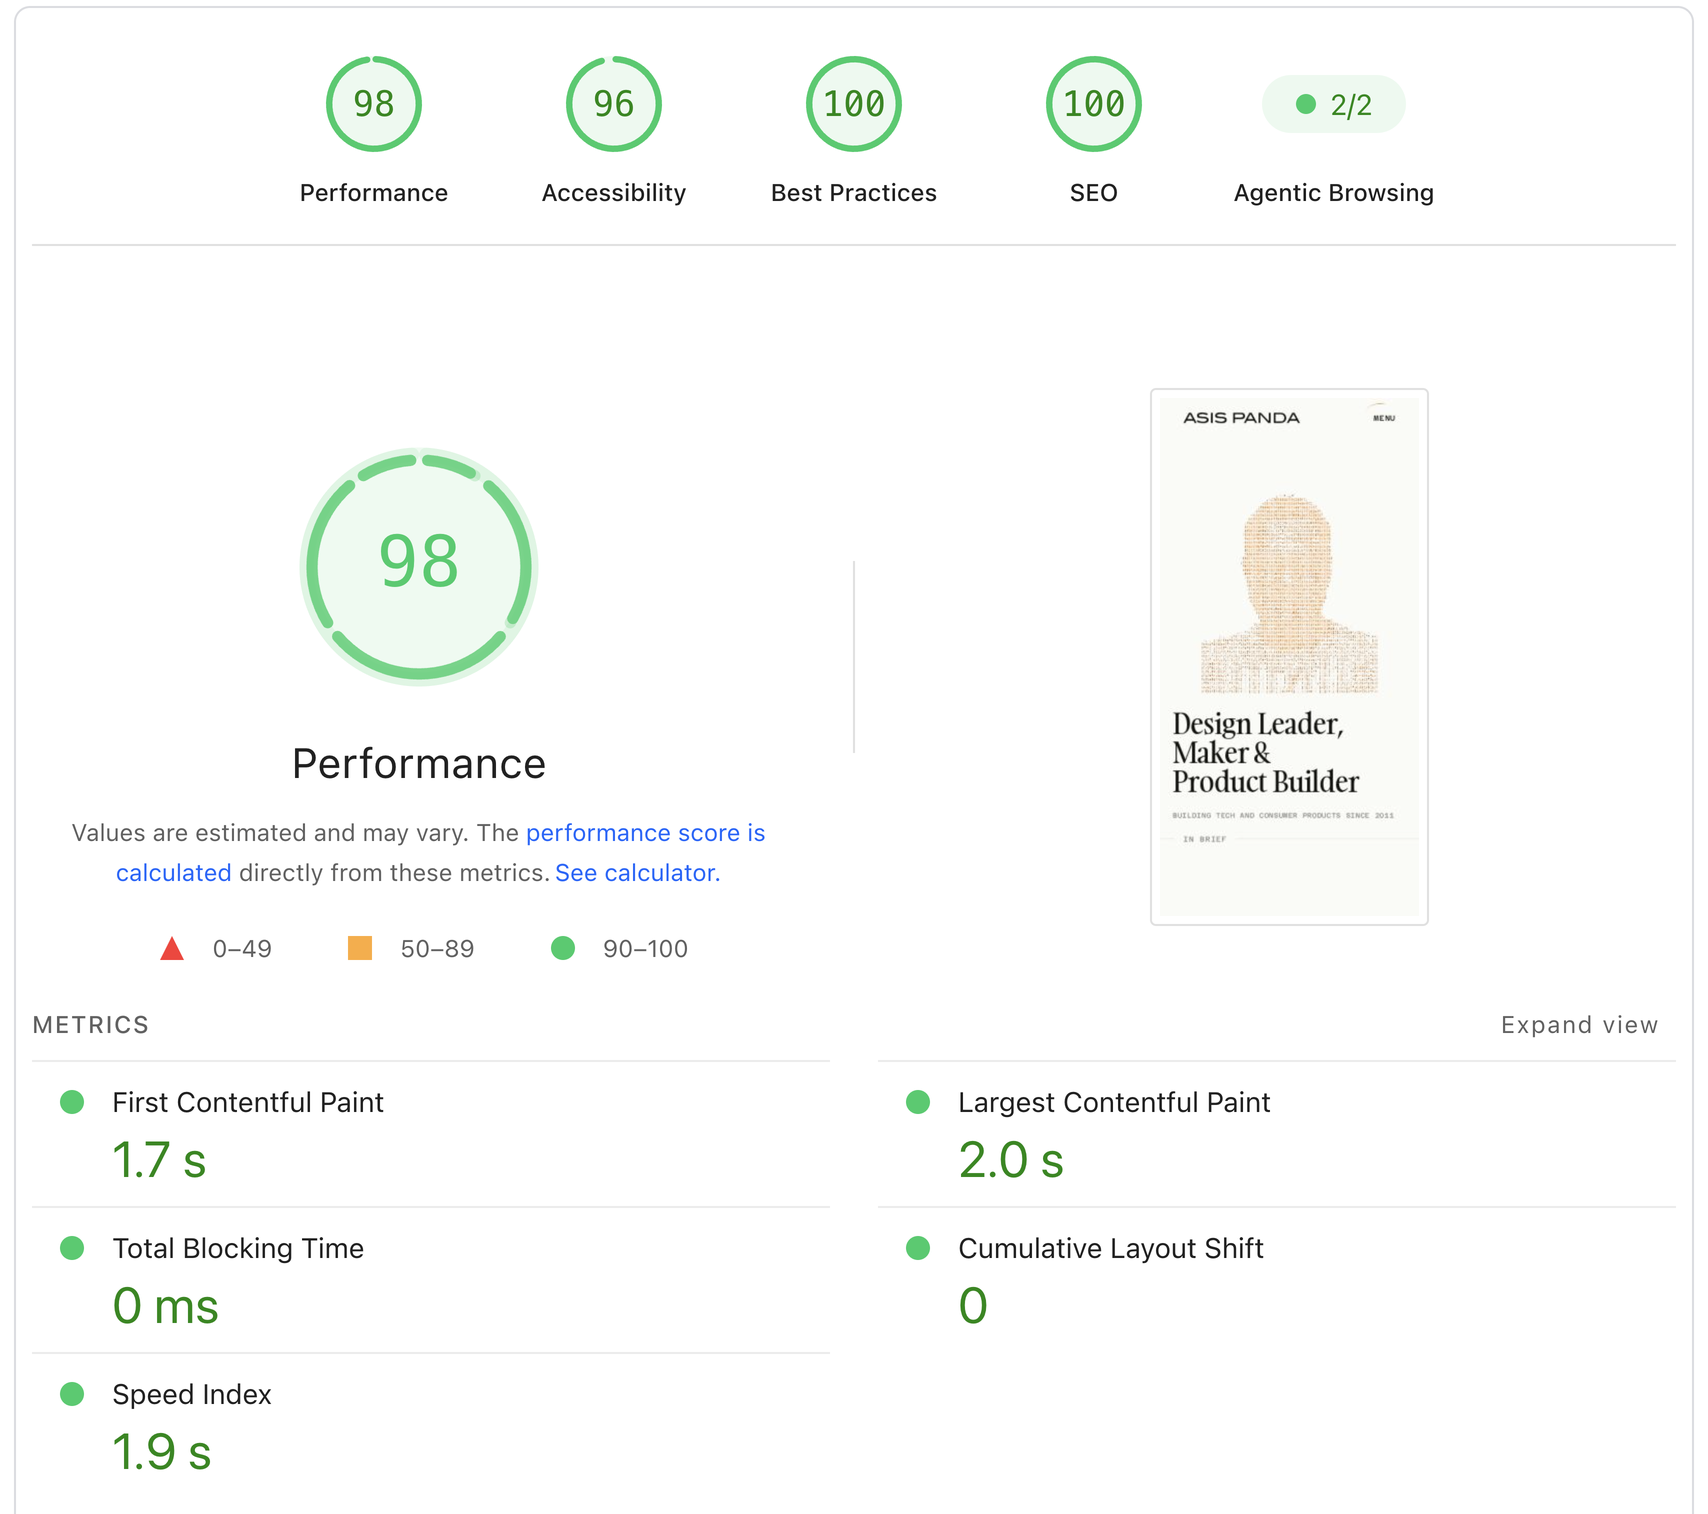
Looking back, very little of this was clever. Most of those 11.6 seconds came from things I had stopped looking at. The site looks exactly as it did on Friday. It has just stopped doing work nobody asked for.